

All four major chip distributors are seeing performance growth, so why is only WT Microelectronics achieving a 100% increase?
01 Four Major Distributors All Beat Expectations in Q1
WT Microelectronics delivered better-than-expected results across all metrics this quarter. Its revenue reached NT$494.3 billion, surging 100% year on year and hitting a record quarterly high, surpassing the upper end of its prior revenue forecast range of NT$460 billion to NT$490 billion. Profitability saw even stronger growth: gross operating profit rose 51% year on year, while operating profit jumped 118% year on year, outpacing revenue growth.
Lin Guannan, the company’s CFO, outlined three key growth drivers during the earnings call. First, the AI data center sector remains buoyant, with revenue from related products accounting for nearly 60% of total revenue. Demand for power components for data centers is particularly robust. Second, inventory adjustments in Europe and the US have been completed, and end-market clients have resumed restocking. Synergies from the integration of Future Electronics continue to materialize, contributing around 10% of total revenue with a relatively high gross margin. Third, non-AI segments across Asia, including automotive, industrial equipment, PCs and mobile devices, are staging a steady recovery.
WPG Holdings also posted its strongest quarterly performance on record. It reported quarterly revenue of NT$316.5 billion, up 27.2% year on year and 23.9% quarter on quarter. This marks its first time exceeding the NT$300 billion quarterly revenue threshold, topping its previous high forecast of NT$275 billion.
Growth is driven by robust shipments of components for AI servers, memory chips, power supplies and networking products, alongside healthy inventory levels restored in industrial and automotive markets across Europe and America. Of greater note is the company’s profitability. WPG Holdings has steadily expanded its Logistics-as-a-Service (LaaS) business, pushing its gross margin higher for five consecutive quarters. The figure stood at 4.26% in Q4 last year and is projected to remain between 4.15% and 4.35% in Q1 this year.
The revenue share of computing power-related applications has risen from 35% to 45% over the past five years, while that of automotive and industrial businesses increased from 21% to 27%, pointing to a gradual improvement in business structure.
Arrow Electronics posted total sales of $9.47 billion in the first quarter, up 39% year on year and 8% quarter on quarter. Its two core businesses delivered solid growth in tandem. Global Components generated $6.64 billion in revenue, accounting for 70.1% of the total and rising 39% year on year. Enterprise Computing Solutions (ECS) recorded $2.83 billion, taking up 29.9% of total revenue and also growing 39% year on year.
By region, the Americas led the growth in Global Components with sales of $2.31 billion, a 47% year-on-year increase fueled by the aerospace & defense, industrial and transportation sectors. The Asia Pacific region saw a 37% rise driven by industrial and data center demand, and Europe, the Middle East and Africa (EMEA) registered a 32% gain. Adjusted earnings per share reached $5.22, surging 190% year on year.
The book-to-bill ratio across all three regions was comfortably above 1, with backlog orders extending into the third and fourth quarters, indicating sustained growth momentum.
Avnet recorded total sales of $7.12 billion in the first quarter, rising 34% year on year and 13% quarter on quarter, also beating market expectations. Its electronic components business generated $6.67 billion in revenue, a 35% year-on-year increase, while the Farnell division posted $450 million in sales, up 24% year on year.
Asia stood out as the primary growth driver with sales hitting $3.46 billion, a 39% year-on-year jump and accounting for nearly half of total revenue. EMEA achieved $2.05 billion in sales, up 31% year on year, and the Americas registered $1.62 billion, a 27% year-on-year gain. All three regions saw both year-on-year and quarter-on-quarter growth.
Adjusted earnings per share came to $1.48, climbing 76% year on year and 41% quarter on quarter. Inventory days decreased from 86 to 77 days. The book-to-bill ratio stayed above 1 across all regions, improving from the previous quarter. Avnet specifically noted that prices of nearly all memory-related products went up this quarter, marking a widespread price rally across the memory segment.
02 Why did Wintech surge 100%?
First and foremost, its AI-related business has posted explosive growth.
Here is a set of comparative figures.
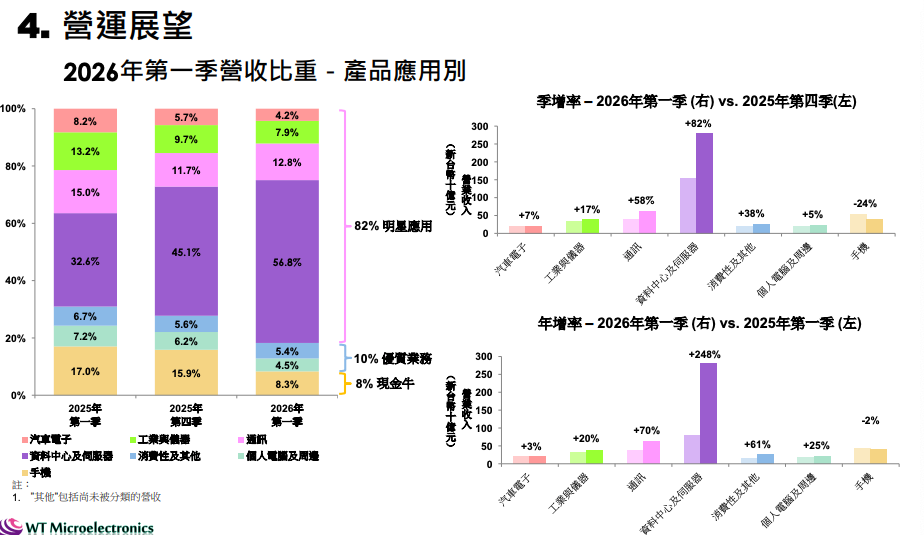
Three years ago, mobile phone business was WT Microelectronics' largest revenue segment, accounting for nearly 30%, while data center business took up only 16.7%. In Q1 this year, the proportion of revenue from data centers and servers has surged to 56.8%, whereas the share of mobile phone business has dropped to just 8.3%.
Source: Wenye Official Website
Within just a few years, WT Microelectronics has completed a full transformation from a chip distributor focused on consumer electronics to one centered on AI.
Its data center revenue jumped 82% quarter on quarter and 248% year on year this quarter. The business’s revenue share soared from 32.6% a year ago to 56.8%. With more than half of its revenue coming from the data center segment that posted a 248% year-on-year surge, its overall revenue doubling becomes easy to understand.
The second growth driver is profit expansion brought by economies of scale.
Future Electronics contributes around 10% of WT’s total revenue, mainly from high-margin product lines, and has also expanded the company’s client network in the European and American industrial and automotive markets. The other three peers have not carried out large-scale external acquisitions during this period, relying largely on organic growth. As WT’s revenue scale expands, its fixed costs are effectively diluted.
While WT Microelectronics' revenue doubled, its operating expenses rose merely 5% from NT$6.75 billion to NT$7.1 billion. The expense ratio dropped from 2.73% to 1.44%, hitting an eight-quarter low.
A notable trend emerged: its gross margin stood at 3.45%, down from 4.58% in the same period a year earlier. This is attributable to AI-related orders, which feature high overall value yet thin per-unit margins. Even so, the operating margin climbed to 2.01%, compared with 1.85% a year ago.
Despite a lower gross margin, the operating margin improved. Large-volume AI orders have fully diluted fixed costs, driving operating profit up 118% year on year — a growth rate outpacing that of revenue. The return on working capital surged from 16.6% to 31.1%, and return on equity (ROE) rose from 10.3% to 24.3%. Both metrics have reached their highest levels in the past eight quarters.
The third reason is that the geographic structure of revenue share happens to align perfectly with the hottest regions.
Approximately 52% of WT Microelectronics’ revenue comes from Greater China, about 35% from the United States, and a very small portion from Europe—exactly the most active regions in the current AI supply chain.
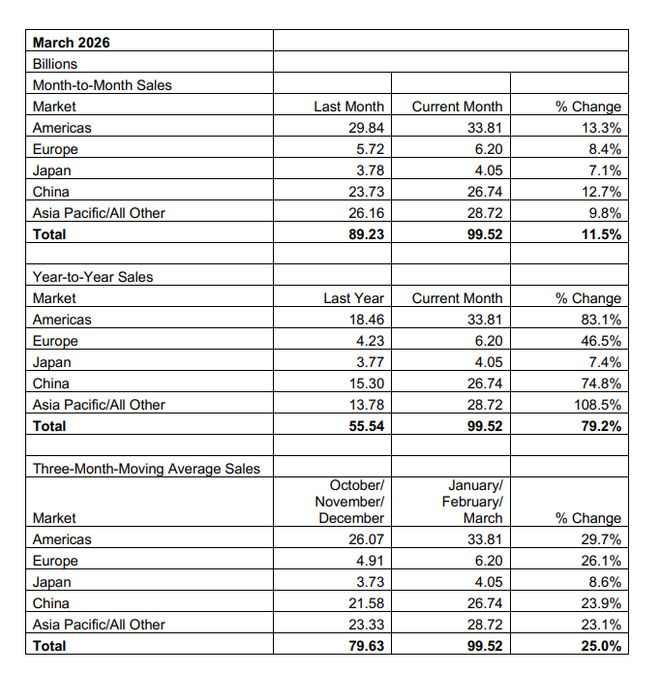
According to SIA data, in March 2026, the Asia Pacific/Other region saw a year‑over‑year increase of +108.5%, the Americas +83.1%, China +74.8%, while Europe only grew +46.5%. Arrow and Avnet have relatively high exposure to Europe, so their growth is naturally held back. WPG derives over 85% of its revenue from Greater China, which explains its impressive month‑over‑month growth of +23.9%—the direction is right, but because its AI revenue share is lower than WT Microelectronics’, its overall price gain naturally lags behind.
03 Concluding Remarks
After the AI wave, the landscape of chip distribution is quietly changing. Asia‑based distributors are becoming increasingly important. How far this shift can go remains to be seen. But at least for this quarter, the company that bet the heaviest on AI has delivered a very convincing answer.


 Whatsapp
 Email
Email Skype
Skype